What are the Key Metrics in Google Analytics 4 to Monitor in 2024?

When I first relaunched our company this year, one of the first posts I wrote was on migrating to the new Google Analytics 4. As of July 2023, Universal Analytics has officially been retired, as have some of the metrics we used to use to benchmark our digital KPIs again. Google Analytics 4 (GA4) is the latest iteration of Google's powerful analytics tool that helps your company identify, track, and measure the goals most relevant to your business. nGA4 is a complete reinvention, focusing on user behavior and marketing strategies, and introducing a slew of new metrics. In GA4, metrics aren't mere numbers, but the pulsating heartbeats of your website's life.
Understanding Key Metrics in Google Analytics 4
Metrics in GA4 are numerical measurements, while dimensions are attributes that provide context to your data. With GA4, Google has enhanced reporting capabilities and introduced new metrics. For instance, the platform has switched from tracking sessions to tracking events, capturing interactions within visits.
It also offers a fresh approach to user engagement, focusing on the quality of views rather than just the quantity. Understanding key metrics in GA4 will allow you to gain valuable insights into your customer's behavior and optimize your marketing strategies. Here are the essential metrics to monitor in GA4 in 2024.
Acquisition Metrics
Acquisition metrics measure how you acquire new customers. Some of the key acquisition metrics in GA4 include:
Sessions: How long people spend on your site
Total Users: Everyone who's visited your site
New Users: People who have never visited your site before
Returning users: A user who’s visited your site or app before
Active users: People who visit your site and are engaged, i.e., browse it for at least a second or click on at least two pages.
Event Count: How many things people do on your site
Engagement Metrics
Engagement metrics measure how users interact with your website and its content. Some of the principal engagement metrics in GA4 are:
Views: The total number of pages or app screens viewed by your users
Engagement Rate: The percentage of users who were engaged on your website or app
Average Engagement Time: The average time users spend engaged with your content
Monetization Metrics
Monetization metrics measure how your clients generate revenue, whether it's from products, ads, or subscriptions. Here are the main monetization metrics in GA4:
Customer Lifetime Value (CLV): The expected monetary value a customer will bring to your business over their lifetime
Total Revenue: The total money your business generates
Other Key Metrics to Track
In addition to the metrics above, there are several other key metrics you should be tracking in GA4:
Event Count: Measures how frequently specific actions (like button clicks, page views, or form submissions) occur within your app or website. Understanding this helps in tailoring user experience.
Target Benchmark: Varies greatly by action type; high numbers usually indicate better engagement.
Conversions: Tracks when a user completes a valuable action on your site, like a purchase, sign-up, or download. This metric is crucial for understanding the effectiveness of your website and marketing efforts.
Target Benchmark: Conversion rates typically range from 2% to 5% for e-commerce websites.
New vs. Returning Visitors: This metric distinguishes between first-time visitors and those who have visited your site before. High numbers of returning visitors can indicate strong user engagement and brand loyalty.
Target Benchmark: A healthy balance is ideal, with a higher percentage of returning visitors being favorable.
Top Exit Pages: Identifies the pages where users are most frequently leaving your site. This can highlight issues with content, navigation, or user experience.
Target Benchmark: Lower percentages are better, indicating fewer users are leaving from critical pages.
Engagement Rate: Measures the level of active interaction by users during a session. It is opposite to the Bounce Rate.
Target Benchmark: Typically, a 70% engagement rate is considered good, with anything above being excellent.
Total Revenue: Reflects the total income generated, crucial for evaluating the financial performance of the business.
Target Benchmark: Consistent growth over time is ideal, with specific targets depending on business size and industry.
Advertiser Ads Clicks: The number of times users have clicked on ads. This is vital for assessing the performance of advertising campaigns.
Target Benchmark: Depends on the industry and campaign goals, but higher click-through rates (CTR) indicate better performance.
Lifetime Value (LTV): Estimates the total revenue a business can expect from a single customer over the course of their relationship.
Target Benchmark: Varies widely; increasing LTV over time is generally favorable.
Sessions Per User: A session is a group of user interactions with your website that take place within a given time frame. This metric provides a broad view of user engagement.
Target Benchmark: The number of sessions can vary greatly, but longer session durations and more pages per session indicate higher engagement.
Views: Refers to the number of page views, which is a basic measure of how much your content is being consumed.
Target Benchmark: High numbers are typically better, but this can vary based on the nature of the site and content.
These averages and targets are general guidelines and can vary based on specific industry dynamics, target audiences, and individual business goals. It's important to contextualize these metrics within your own business environment for accurate analysis and strategy development.
Embracing the User-Centric Approach
New product = new reports. GA4 puts users at the heart of every metric, report, and insight. It’s not about counting visits; it’s about understanding experiences. It’s about swapping the stopwatch of UA for the photo album of GA4, where every interaction tells a story.
So an example of a user-centric approach would be creating a goal for engagement. So let’s create a scenario for defining a successful “engaged session.”
We want someone to download a white paper. This user:
Comes to your website,
Has two or more page views/ screen views,
Has an average session duration of 10 seconds or longer,
And had a conversion event, like filling out a lead conversion form.
If this is our scenario, you can benchmark our KPI’s effectiveness as to whether you’ve achieved this or not, and how that goal is or isn’t being achieved.
If you’re not getting at least two page views, with a session duration of 10 seconds or longer, and the user didn’t fill out the form, then you can make a decision on how to improve the experience in order to get your desired action.
PSST…This is also why it’s crucial to use Google UTMS. They ensure accurate tracking.
A Deeper Dive into Exploring Events and Conversions with a Experience First Approach
In GA4, events are the new cool kids on the block. They're not about tracking visits but about capturing interactions. Gone are the old metrics of “one conversion per session for each goal”, you’re now looking at hundreds of micro interactions. It’s really important to understand how GA4 counts events through its new event count metric. In addition, GA4 has an enhanced event measurement option that tracks the following events:
File downloads
Form interactions
Outbound clicks
How often has someone used your site search
Scrolling behavior
User engagement on YouTube videos
GA4 comes with a list of predefined conversions, but you can create custom conversion events like:
An add-to-cart and an e-commerce purchase
Downloading an app
Starting a subscription
conversions = important interactions
Exploring the event-based model of GA4 isn't about learning a new metric; it's about reimagining the way we understand user behavior.
Experimenting with GA4's Analysis Hub
For those of you that really want to dig deep into insights, GA4's Analysis Hub is worth exploration.
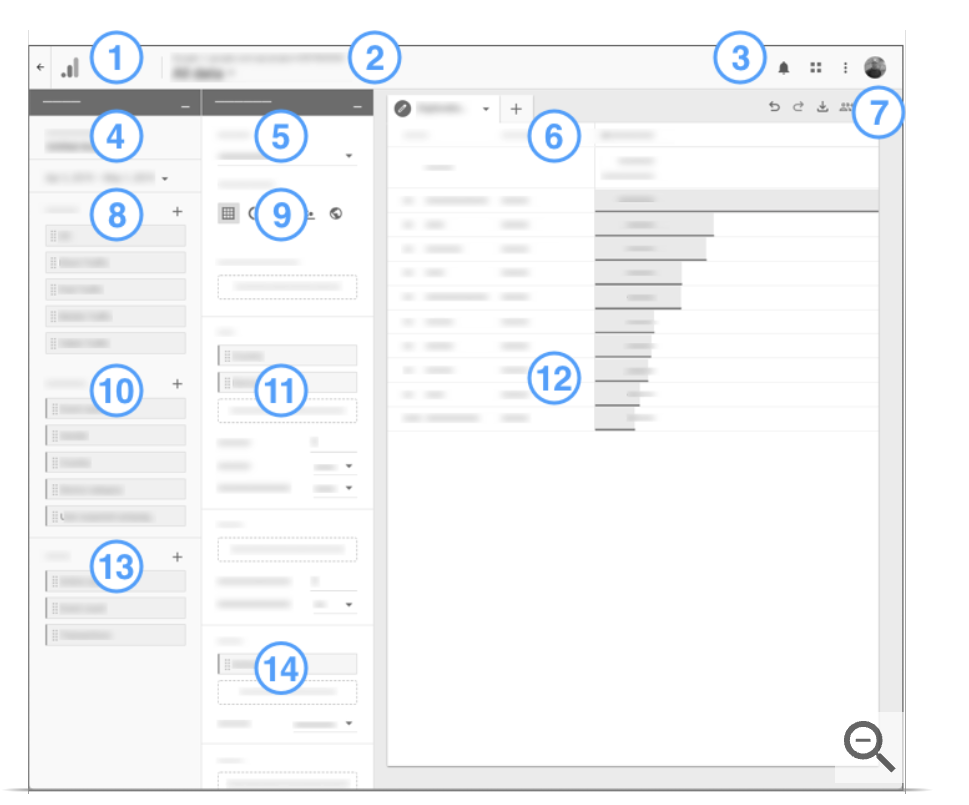
It offers an array of templates and techniques to dissect data. It's about creating bespoke analyses tailored to unique needs. You can use explorations to:
Quickly perform ad hoc queries,
Easily configure and switch between techniques,
Sort, refactor, and drill down into the data,
Focus on the most relevant data by using filters and segments,
Create segments and audiences,
Share your explorations with other users of the same Google Analytics property,
And export the exploration data for use in other tools.
If you want a better understanding of your data, but don’t have the technical expertise to create dashboards, drop me an email, my team and I can help you.
Additional Support Links I Love: