YouTube: Video Metrics that Matter, KPIs, and Driving Conversion

When it comes to YouTube videos, what are the metrics that matter when you create reports on Youtube video content? More importantly, how do you align YouTube video metrics to your company's KPIs?
As a marketer, understanding YouTube video metrics is pretty darn important. I’ve been diving deep into the world of Youtube in hopes creating:
A way for marketers and creators to understand how to optimize video content for their channel audiences, but also think about how it plays into bigger picture of SEO.
Help them think of creative ways to use video for brand building.
But most importantly, how to start to measure the effectiveness of video content and align them with company KPIs and an conversion metics.
Why? Because I believe that any channel your investing time and energy into needs to deliver results in more than one area, and holistically be used across any customer’s journey. So let’s start with the importance of video metrics…
Importance of YouTube Video Metrics
When you take a walk through Youtube, whether it be a creator’s advice on views and building an audience, or talk to a brand marketer using video as part of their content strategy, the ideas surrounding audience and action are limited. Analyzing the performance of your YouTube videos is not just about counting views or how many subscribers your channel gains. Evaluating video performance needs to involve a detailed understanding of various metrics that give you deeper insights into how your audience interacts with your content. This analysis is crucial to:
Identify what type of content resonates with your audience,
Understand the behavior of your viewers,
Evaluate the effectiveness of your video content strategy,
Make informed decisions to improve future video content.
Distinction Between YouTube Metrics and KPIs
Before diving into the specific metrics, it's important to distinguish between YouTube metrics and KPIs. While both are essential for measuring performance, there's a difference in their purpose:
YouTube Metrics: These are broad measurements that provide insights about your video's performance. They include views, watch time, and subscribers.
YouTube KPIs: These are specific metrics that are directly tied to your business goals. They provide a clear understanding of whether your video content is contributing to your overall business objectives.
Essential YouTube Video Metrics to Track
Let's explore the key YouTube metrics that every marketer should track to effectively evaluate their video content's performance:
Metric #1: Channel Metrics
Tracking the growth of subscribers and followers can provide valuable insights into the potential influence and authority of your brand.
Subscribers
Subscribers are a clear indicator of your channel's popularity. They are your most loyal fans who choose to follow your content and receive updates about your new videos. A steady increase in subscriber count signifies the effectiveness of your video content in attracting and retaining viewers.
Most Popular Videos
Identifying your top-performing videos in terms of views and engagement provides valuable insights into what kind of content resonates with your audience. It helps you understand what elements in your video content are attracting views, enabling you to replicate those in your future videos.
Metric #2: Reach Metrics
Views and watch time are the fundamental metrics that offer insights into your video's reach and the duration for which viewers engage with your content. These metrics act as the initial indicators of your video's popularity and its ability to retain viewer attention.
Views
Views are the broadest and most basic measure of your video's performance. They represent the number of times your video has been watched. However, views alone don't provide a complete picture of your video's success. For a more comprehensive analysis, views should be evaluated in conjunction with other metrics like watch time and engagement.
Unique Viewers
Unique viewers represent the estimated number of individuals who watch your videos within a specific period. This metric gives you a clear understanding of the actual size of your audience.
Traffic Sources
Traffic sources provide information on how viewers are finding your videos. They can be from YouTube search, external websites, playlists, or suggested videos. Understanding your traffic sources allows you to optimize your video promotion strategy. You can find the keywords that people searched for that brought them to your videos in YouTube Studio Analytics. Just go to Analytics > Reach > YouTube Search Terms.
Impressions and Click-Through Rates (CTR)
Impressions represent the number of times your video thumbnail is shown to viewers. CTR is the percentage of impressions that turned into views. It measures your video's ability to attract viewers to click and watch your content.
Metric #3: Engagement Metrics
Engagement metrics, including likes, comments, shares, and reactions, offer qualitative insights into audience interactions. These metrics can help gauge the emotional impact of your videos on viewers and provide a measure of audience satisfaction.
Watch Time
Watch time, also referred to as audience retention, is the total amount of time viewers have spent watching your videos. It's a crucial metric as YouTube's algorithm uses watch time to rank videos in search results and recommendations.
Likes, Dislikes, and Comments
These metrics provide a qualitative understanding of your video's performance. They indicate your audience's emotional response to your video content. A high number of likes and comments signify positive audience engagement.
Re-Watches
Re-watches represent the number of times a specific part of your video is re-watched by viewers. It indicates the parts of your video that viewers find most interesting or informative. To find Rewatches in YouTube Studio: Analytics > Engagement > Audience retention > Absolute audience retention
Playlist Engagement
Playlists are a great way to organize your videos and make them easily accessible to your viewers. Metrics like views per playlist start and average time in playlist provide insights into how effectively your playlists are engaging viewers.
Metric #4: Audience Metrics
Subscriber Growth
Tracking subscriber growth over time helps you understand how effectively your video content is attracting new subscribers. It also provides insights into your channel's potential for long-term growth.
Audience Retention
Audience retention refers to the percentage of viewers who continue to watch your video at each moment throughout its duration. It's a key metric for understanding how engaging your video content is to viewers.
Demographics
Demographics provide insights into the age, gender, location, and language of your audience. This information can help you tailor your video content to better suit your audience's preferences. You can find demographics in Analytics > Audience > Age and Gender.
Tying YouTube Metrics to Your KPIs
As I mentioned at the beginning of the article, KPIs are specific metrics that are directly tied to your business goals. And you should be applying those KPIs to YouTube in order to understand if video content is contributing to your goals. In order to align your video content strategy to your KPIs, Think With Google offers these five questions:
What is your primary marketing goal for this campaign?
What are the KPIs for that marketing goal?
Which KPIs should we be tracking to understand if our video campaign is successful?
What are the best video analytics tools to measure your KPIs?
How will you optimize for your KPIs?

To take that into a more tactical application, here are a few examples I’ve created.
More Website Traffic: If you have a goal to drive more traffic from video content, then you’d want to track “clicks to website.” Why? Because monitoring how many viewers click through to your site from the video becomes a critical KPI.
Grow Our Newsletter Subscribers: Another example could involve your overall “conversion rate”. If your video has a specific call-to-action (CTA), tracking the conversion rate becomes crucial to assess the effectiveness of the CTA in driving desired actions, such as sign-ups, opt-ins, or purchases.
Connection the dots between YouTube Analytics and Google Analytics
If you’ve aligned your YouTube video content strategy to your KPIs, The next question you may have is about how to track and measure your KPIs. You two best choices are actually Google’s own two analytics platforms:
YouTube Analytics: YouTube's built-in analytics tool offers data on views, watch time, audience demographics, and engagement metrics. This tool is a must-have for anyone hosting videos on YouTube.
Google Analytics: For tracking video performance on your website, Google Analytics offers features to monitor video interactions, user behavior, and conversion rates. You’ll also want to create a property in your GA4 setup to track and integrate YouTube into your overall analytics.
Pro Tip: If you’re using video in Google Ads, you’ll want to look at those campaigns as well.
Tracking Metrics and KPIs in Looker Studio
Many of you can look at YouTube Analytics and getting a decent amount of data from that data set.
But what if you want to connect the dots to KPIs and conversion metrics that make you money?
What if understanding the YouTube in-platform analytics is challenging to measure and easily make connections on how video is impacting your KPIs?
Well, then we can build a dashboard in Looker Studio. There are a lot of templates out there (some offered by data connectors, some sold on marketplaces), I decided to take the guesswork out connecting strategy to revenue, and built my own dashboard sets for clients that show them how views, engagement, and YouTube subscriber behavior is driving their bottom line.
Here’s an example of some of the ways you better visualize your data:
Overview of All Time YouTube Channel Performance
It’s always good to take a top down look at your channel’s performance. Your channel offers historical data views and can show performance and growth over the lifespan of your channel. You can use this look at the velocity of your growth, and what the cumulative effect of your content is so it can better inform the use of video in your content strategy (the data source here is YouTube’s API).

How Viewers or Subscribers Find Your Videos
I want to know how viewers (who could potentially become subscribers to a channel) find videos. This example shows you if views come from external Google searches, other YouTube Channels, your channel, your playlists, or other YouTube features. This offer the opportunity to understand how to better optimize your videos for search/discovery (the data source here is YouTube’s API).

How Video Tags and Categories Impact Video Discovery
In looking at how someone finds videos, I think it’s important to look at an search dimension available to us. That includes those tags and video categories you’re offered when your publish a video. Looking at tags and categories tells you if certain formats or educational topics are resonating better with viewers, and you can better optimize your videos to search, while also meeting your audiences interests (the data source here is YouTube’s API).

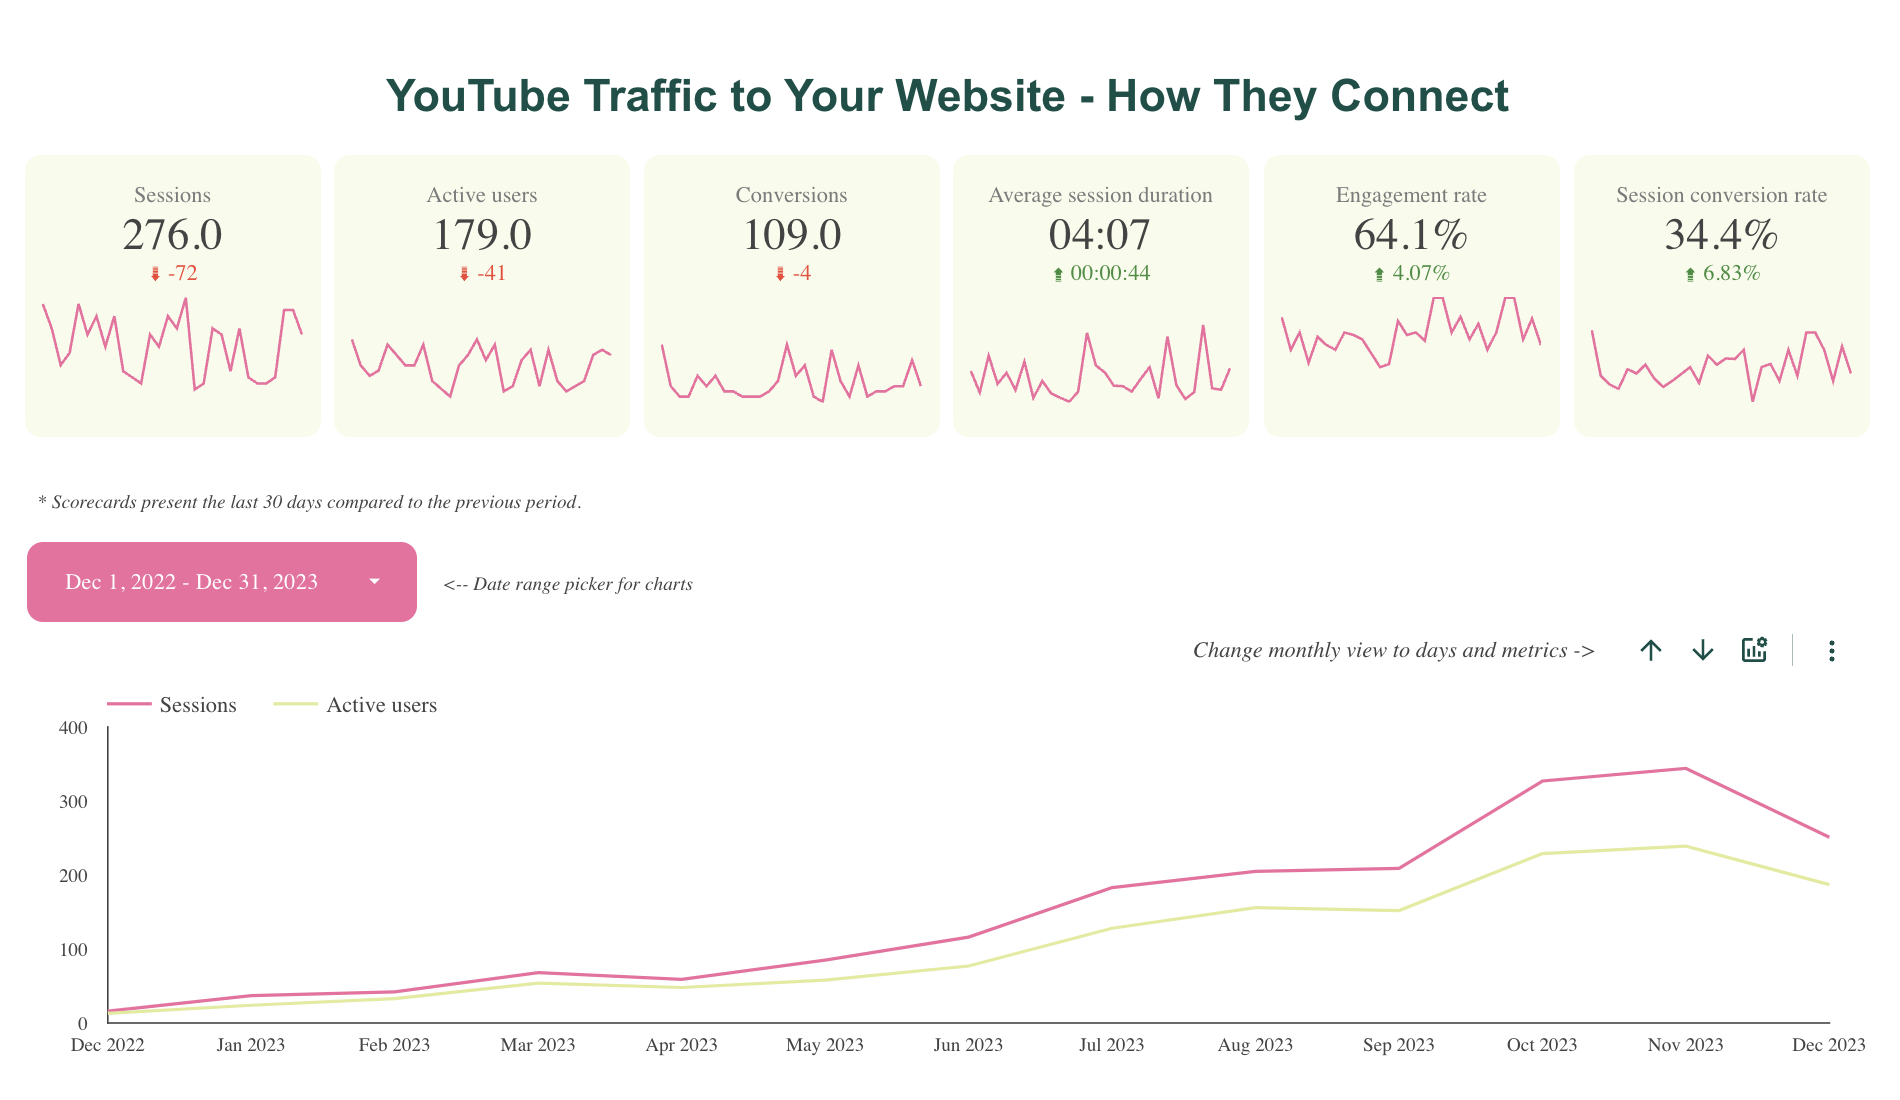
What Viewers Do Once They Get to Your Website?
To piggyback on my points in this article on tying your video content to harder metrics and KPIs, here’s where I see the failure. Most of the analytics connectors and dashboard templates don’t go the extra step to tie traffic from YouTube to your owned properties together.
If you’re selling a course, services, a membership, or ANYTHING where people give you money, why would you not do this?
If you’re putting time and money into creating video content, don’t you want to know how that content is feeding into your business goals?
I can’t show you the nitty gritty here, but you can the dots to conversion. Course sales, email newsletter subscriptions, lead generation opportunities. Anything you want, it’s all in how your events and conversion goals are set-up in Google Analytics 4, and of course how you’re using UTMs to tag your traffic.
34% conversion rate? Do I smell money?
From the image below, aren’t you curious to see how the 276 visits to your website from YouTube, generated 109 conversion events (this event was set to a digital product sale) that resulted in a 34.4% conversion rate?
What are getting from your social media ads - maybe 2-5%? Ummm, I see money, money, MONEY - that isn’t coming from Facebook and Instagram ads….
Now Let’s Your Analysis On
What I’ve shown you is just the tip of the ice berg. By understanding these metrics, you can make data-driven decisions to improve your video content, enhance engagement, and ultimately, achieve your business goals. Remember, the most effective YouTube strategies are those that are continuously tested, measured, and refined based on insights derived from YouTube metrics. More importantly, you can stop spending time in money in channels that don’t deliver on your goals. Want a custom set of dashboards? send me an email.